Paywall Design Study
In February 2021, TIME launched a digital registration and subscription program. Under this program, users could register for a free account in order to read four articles on TIME.com. When they went to read their fifth article, they would instead encounter a paywall and be required to purchase a subscription in order to continue reading. The users who reached this paywall were our most loyal and engaged readers, and we wanted to improve our paywall design to most entice them to subscribe. We ran two concurrent think-out-loud studies to discover preferences on what made the paywall the most compelling. After releasing the new designs, we saw a 31% increase in subscription conversions across all devices.
ROLE: UX + UI Design Lead
UX RESEARCH
THInk-Out-Loud Study
Visual Design
RESULTS ANALYSIS
In Collaboration With:
USERZOOM, MARKETING, PRODUCT

The Problem
The paywall is shown to registered users who exceed their number of free articles. This set of users is highly engaged, and therefore potentially likely to convert to paid subscribers. The current paywall was simple, and minimal. It also focused predominantly on the limit of articles imposed, not on the benefits of taking the next step. Could an enhanced paywall design help improve subscription conversions?


The Study
We performed two concurrent, think-out-loud studies, each with 10 participants. In each study, we showed the participants a set of potential paywall designs, and asked them to select which they preferred, explain why they preferred it, and describe whether or not they found it compelling. As a control, the first design option in both studies was the currently-live paywall.
One group was shown the desktop designs on their desktop device, while the other group was shown the mobile designs on their mobile device. The tasks and questions in the studies were otherwise identical.

Desktop Paywall Option A
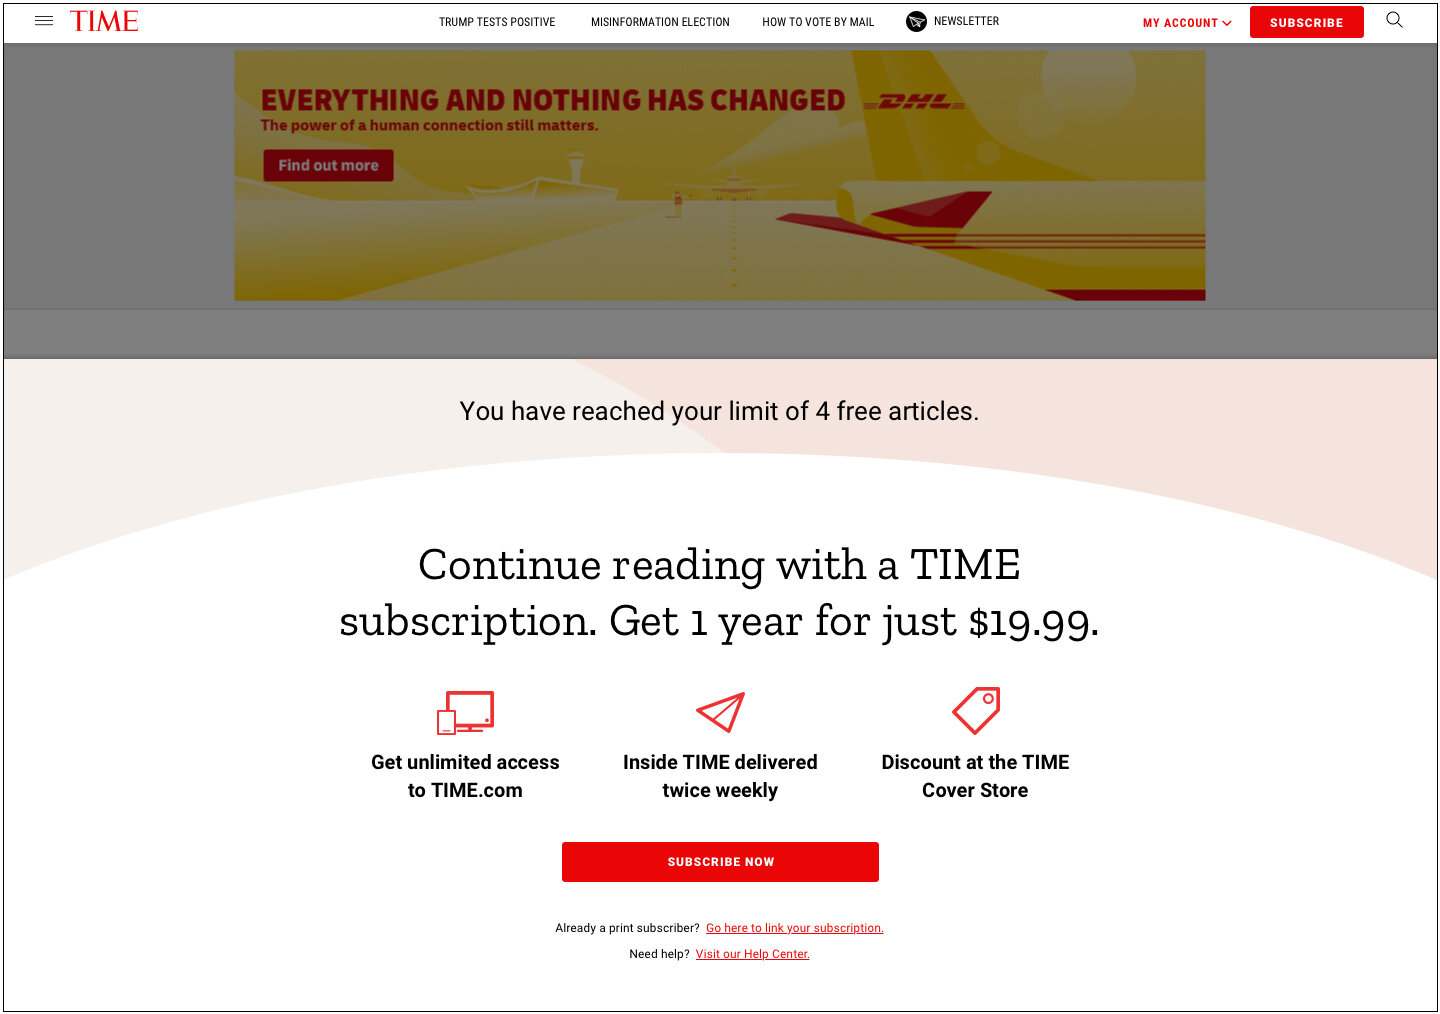
Desktop Paywall Option B

Desktop Paywall Option C

Desktop Paywall Option D
Why separate mobile and desktop into different studies?
When viewing both desktop and mobile mockups, people have a tendency to choose a design they prefer, and then simply select its equivalent “pair” for the other device. In reality, someone viewing the paywall on mobile — without any knowledge of its desktop appearance — may prefer or value different things in layout, size and emphasis.

Mobile Paywall Option A

Mobile Paywall Option B

Mobile Paywall Option C
Who participated in the mobile study?
Age
Income
Gender
Registered TIME users?
Who participated in the desktop study?
Age
Income
Gender
Registered TIME users?
How often do they read TIME.com?
Which other news sites do they read?
Are they a paid subscriber to any other news sites?
Results
The think-out-loud studies confirmed two key points: users preferred a more detailed, eye-catching design, and they liked to see the subscription benefits listed out explicitly. The studies also confirmed that the design that was most compelling on mobile was different than the most compelling desktop design.

60% of desktop study participants preferred Design B.
80% found the new design concepts to be compelling. They liked the centered design, and found the icons eye-catching and helpful to illustrate and highlight each benefit.


50% of mobile study participants preferred Design C.
70% found the new design concepts to be compelling. Users liked the clean design and the bullet points. They found it less cluttered and easier to understand than the other designs.


Solution
We implemented Design B on desktop and Design C on mobile. After releasing the changes, subscription conversions increased MoM up by about 26% on desktop, 47% on mobile, and 31% across all devices.


